We find what is actually slowing your WordPress site down, fix it, and get you into the "good" Core Web Vitals band, on your own hosting, with everything backed up first. No vanity scores, no guesswork.
Free audit, no obligation. Ongoing speed care is included in every maintenance plan.
Speed is not a vanity metric. It shows up in three places that affect your business directly: conversions, search visibility, and trust. A slow site loses visitors before the page even finishes loading, and every extra second of delay quietly costs you people who would otherwise have stayed, read, and bought.
The conversion effect is the one that hits your revenue first. When a page is slow, some share of visitors simply give up and leave before they see your offer. They do not email to complain; they just never arrive. On a site that runs ads or does any kind of lead generation, that is money spent to send people to a page they abandon. Faster pages keep more of the traffic you already paid for.
On the search side, page speed is part of Google's page-experience signals, measured through Core Web Vitals. It will not vault a weak page to the top on its own, but in a close contest, and especially on mobile, it is a genuine edge, and a poor experience can hold an otherwise strong page back. Just as importantly, a fast site simply feels more professional. Speed is the first impression a visitor forms before they read a single word, and it colours whether they trust you enough to book, buy, or bounce. If you want the wider picture of why an unmaintained site quietly costs money, we cover it in why website maintenance matters.
Website speed optimization is the process of finding the specific bottlenecks on a site and fixing them, then measuring the result. That word "specific" is the whole point. Two slow sites are almost never slow for the same reasons, so there is no universal fix and no plugin that does the job by itself. A real optimization is diagnostic first: you measure where the time goes, then you fix the biggest offenders in order of impact, then you re-measure to prove it worked.
This matters because most of what is sold as "speed optimization" is really just a caching plugin switched on and a screenshot of a higher lab score. That can help, but it leaves the real bottlenecks untouched, and the improvement often evaporates the next time the site changes. Genuine optimization is closer to diagnosis and repair than to installing an app.
To understand why a site is slow, it helps to know what happens between a click and a finished page. It runs in a chain, and the page is only as fast as the slowest link.
First, the browser looks up your domain and connects to your server. Then it waits for the server to respond with the first byte of the page, the delay known as Time to First Byte, which your hosting largely controls. Next, the browser reads the HTML and discovers everything else it needs: CSS, JavaScript, fonts and images. Some of those files are "render-blocking," meaning the browser will not paint anything until it has fetched and processed them. Finally, it lays everything out, runs the JavaScript, and the page becomes visible and interactive.
Slowness can enter at any point in that chain. A slow host delays the first byte. Render-blocking CSS and JavaScript delay the first paint. Heavy images delay the main content. Too much JavaScript delays interactivity, so the page looks ready but does not respond when tapped. Real optimization means knowing which link in the chain is actually slow for your site, and there is no way to know that without measuring. The web performance fundamentals on MDN describe this pipeline in more depth.
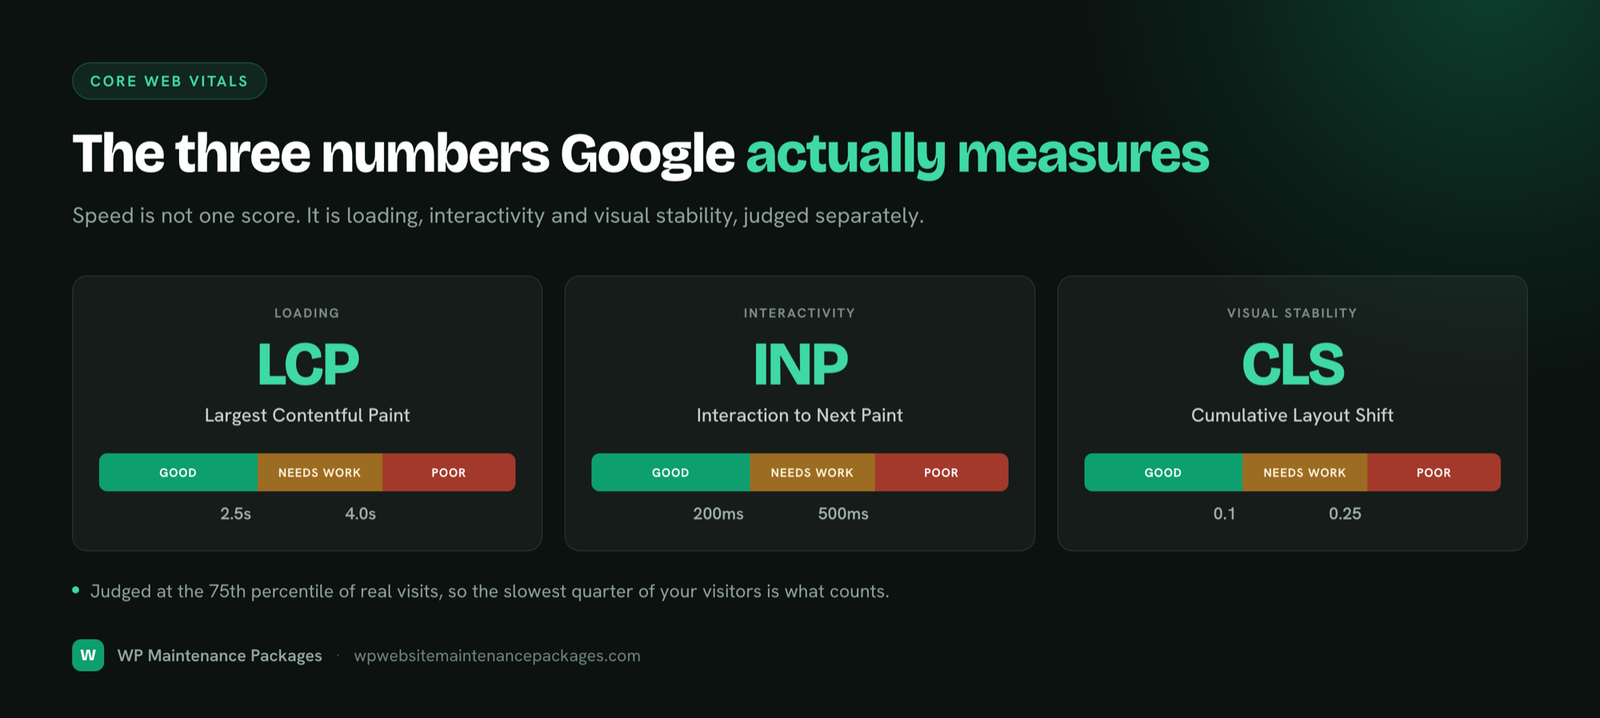
Google measures page experience through three real-user metrics. You do not need to be technical to understand them, and they are the targets we actually optimise toward, not a vanity PageSpeed number. You can check your own site any time with PageSpeed Insights.

| Metric | What it measures | "Good" target |
|---|---|---|
| LCP | Largest Contentful Paint: how fast the main content appears | Under 2.5 seconds |
| INP | Interaction to Next Paint: how quickly the page responds to taps and clicks | Under 200 ms |
| CLS | Cumulative Layout Shift: how much the page jumps around while loading | Under 0.1 |
| TTFB | Time to First Byte: how quickly the server starts responding (feeds into LCP) | Under 800 ms |
Here is the distinction almost everyone misses. The score you get from PageSpeed Insights or Lighthouse is lab data: one test, one simulated device, useful for diagnosis. What Google actually uses for ranking is field data: how real Chrome users experienced your pages over the last month, collected in the Chrome UX Report. You can see your field data in Google Search Console under the Core Web Vitals report.
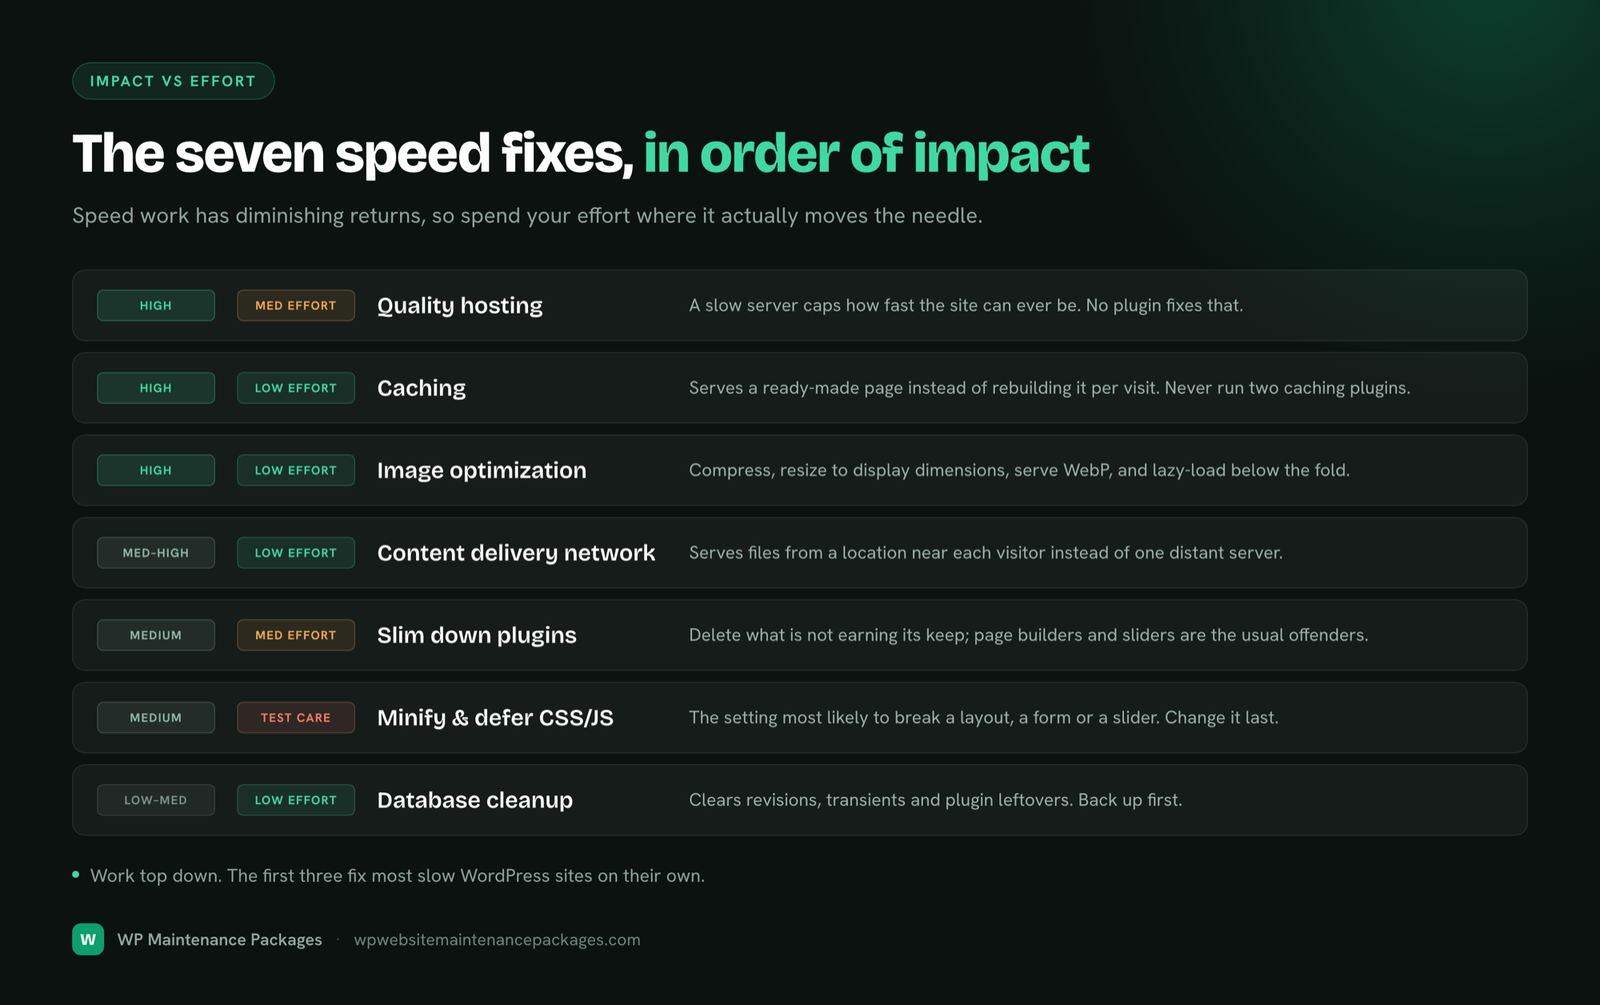
Slowness is almost always a stack of causes, not one villain. Here are the usual suspects, what each one does, and what fixes it. A proper audit tells us which of these are actually hurting your site, and by how much, so we fix the ones that matter rather than guessing.

| Common cause | Why it slows the site | What fixes it |
|---|---|---|
| Slow or oversold hosting | Delays the first byte and caps everything downstream | Better host or server tuning, current PHP, object caching |
| Unoptimised images | Full-size files are often the single heaviest thing on a page | Compression, WebP/AVIF, correct dimensions, lazy loading |
| Render-blocking CSS & JS | The browser waits for them before showing anything | Critical CSS, deferring and delaying non-essential scripts |
| Too many or heavy plugins | Each can add scripts and database queries to every page | Auditing and removing or replacing what does not earn its weight |
| Bloated database | Old revisions and autoloaded options slow every page load | Cleaning revisions, transients and autoloaded data |
| Third-party scripts | Chat, trackers and embeds run other people's slow code on your page | Removing, delaying or self-hosting where possible |
| No or misconfigured caching | The server rebuilds every page from scratch on each visit | Correct page, browser and object caching |
| No CDN for a wide audience | Distant visitors wait for assets to travel across the world | A content delivery network with modern delivery |
Speed work should be measured, prioritised and reversible. We never make blind changes on a live site. Every step starts from data and ends with a backup-safe, tested result.
We measure with lab and field data to see where the time actually goes: LCP, INP, CLS, server response, page weight and requests.
We identify the specific issues that matter for your site, not a generic checklist, and rank them by real impact.
We fix the biggest wins first. One render-blocking script can matter more than ten small tweaks combined.
We back up, then implement: caching, images, CSS/JS, fonts, database, server and third-party scripts, safely.
We re-measure against the same metrics and test the site works, including forms and checkout, so nothing broke.
You get a clear before-and-after of the real numbers, then we monitor so the site does not slowly drift back.
A full optimization touches the whole stack, from the server up to the third-party scripts on the page. Which of these need work depends on your site, and the audit tells us where the time is going. Here is what each lever does.
PHP version, server response time, object caching and Redis where available, and an honest verdict if the host itself is the bottleneck.
Page, browser and object caching configured correctly, so returning visitors and repeat requests are near-instant.
Compression, modern formats (WebP/AVIF), correct dimensions, responsive sizes and lazy loading below the fold.
Critical CSS, minification, removing unused code, and deferring or delaying scripts that block the first paint.
Preloading key fonts, font-display swap, and trimming weights so text is never invisible or shifting on load.
Clearing revisions, expired transients and autoloaded bloat that quietly slows every single page load.
Finding heavy or redundant plugins and page-builder bloat, and reducing what loads on each page.
Chat widgets, analytics, embeds and trackers delayed, self-hosted or removed where they cost more than they add.
A content delivery network plus modern protocols (HTTP/2, HTTP/3, Brotli compression) so assets arrive fast, wherever visitors are.
On the delivery side specifically, modern protocols make a real difference: HTTP/3 reduces connection delay, and Brotli compresses text files smaller than the older gzip. Services like Cloudflare provide these, and the practices in the WordPress documentation underpin the platform-specific work, but the judgment of what to apply where is what actually makes a site fast.
WordPress speed is its own discipline. The plugin and theme ecosystem that makes WordPress powerful is also what makes it slow when it is not managed: every plugin can add scripts and queries, page builders like Elementor and Divi add weight, and the database fills up over time with revisions and autoloaded options. A generic "speed up any website" approach misses the WordPress-specific bottlenecks, which is where most of the real slowness lives. Our WordPress maintenance services keep this in check week to week, and a one-off optimization resets a site that has already drifted slow.
Stores need the most care and benefit the most. WooCommerce is heavier than a standard site by design: it cannot fully cache cart and checkout pages because they are personal to each shopper, it runs more database queries, and it often carries payment, shipping and tax scripts. Speeding up a store means optimising what can be safely cached, tuning the database and server for the dynamic parts, and testing the entire checkout after every change, because a fast homepage means nothing if checkout breaks. That specialist work lives on our ecommerce maintenance page.
Google measures your site the way most people use it: on a mobile phone, often on a slower connection than your office wifi. A site that feels fine on your desktop can be sluggish on a mid-range Android on 4G, and that mobile experience is what feeds your Core Web Vitals and your rankings.
Mobile is harder because phones have less processing power to run JavaScript, smaller screens that still download full-size assets if you let them, and more variable networks. Optimising for mobile means being ruthless about JavaScript, serving correctly sized images for small screens, and making sure the most important content loads first. We test on realistic mobile conditions, not just a fast desktop, because that is the experience that actually counts.
We do not publish fabricated before-and-after numbers, because real results depend entirely on the starting point, and inventing client figures would be dishonest. What we can be precise about is the target. A successful optimization moves a site into the "good" Core Web Vitals band on real mobile devices and holds it there.
| Metric | Struggling site (typical) | Our target |
|---|---|---|
| LCP | 4 seconds or more | Under 2.5s |
| INP | Sluggish, over 200ms | Under 200ms |
| CLS | Visible jumping, over 0.1 | Under 0.1 |
| TTFB | Slow server, over 800ms | Under 800ms |
Your free audit gives you your current numbers up front, so you know exactly where you stand and what is realistic before any work begins. No surprises, no invented promises.
Plenty of well-meaning speed work backfires. These are the ones we see most often, and undo most often.
You can do a lot yourself if you have the time and the comfort with the technical side. The risk is that the fixes that matter most (critical CSS, script deferral, database work, server tuning) are also the ones most likely to break a live site if done blindly. Here is the honest trade-off.
| Do it yourself | Professional optimization | |
|---|---|---|
| Best for | Simple sites, low stakes, time to learn | Business sites, stores, anything earning money |
| The easy wins | Caching, image compression, plugin cleanup | All of that, done and verified |
| The risky wins | Easy to break the site without a safety net | Backed up first, tested, reversible |
| Measurement | Often lab-score chasing | Field-data driven, real Core Web Vitals |
| Staying fast | Drifts slow again over time | Monitored so it holds |
If you want to try the groundwork yourself first, our free website maintenance checklist includes the performance tasks worth doing on a schedule.
A speed optimization with us is not a mystery. Here is exactly what you walk away with.
A US-based team that works on WordPress and WooCommerce every day, so we know where these sites actually slow down.
We optimise for real Core Web Vitals, not vanity lab scores. The target is your users' experience, not a screenshot.
Every change is preceded by a backup and followed by testing. Speed is never gained by breaking something.
We work on your own hosting account and tell you plainly if the host is the real bottleneck. No reselling, no lock-in.
Practical experience diagnosing slow WordPress sites, heavy page builders, plugin conflicts and store performance.
One-off optimization or ongoing care, your choice. Plans are month-to-month, so we keep you by being good.
Start with a free speed audit. You'll get your real Core Web Vitals, the specific bottlenecks, and a plain-English plan, with no obligation to hire us.
Get a free speed auditWebsite speed optimization is the work of making a site load and respond faster by finding what is actually slowing it down and fixing those specific things. It is not one action. It covers server response time, caching, image delivery, CSS and JavaScript, fonts, the database and third-party scripts. The right fixes depend entirely on the individual site, which is why a real optimization starts with measurement, not a plugin.
Usually several causes stacked together: slow or oversold hosting, full-size images, too many plugins each adding scripts and queries, render-blocking CSS and JavaScript, a bloated database, and third-party scripts like chat widgets and trackers. Page builders such as Elementor add weight too. No two slow sites are slow for exactly the same reasons, so the first job is measuring where the time actually goes before touching anything.
Yes, but not in the simple way people assume. Speed is part of Google's page-experience signals through Core Web Vitals, so it can help rankings, especially on mobile and in close contests. It also affects conversions and bounce directly. But a fast site does not automatically rank first; rankings depend on many factors, and speed is one input, not a guarantee. Anyone promising rankings purely from speed is overselling it.
Core Web Vitals are three real-user metrics Google uses to measure page experience: LCP (Largest Contentful Paint, how fast the main content appears), INP (Interaction to Next Paint, how quickly the page responds to taps and clicks), and CLS (Cumulative Layout Shift, how much the page jumps around while loading). The "good" thresholds are LCP under 2.5s, INP under 200ms, and CLS under 0.1, measured on real devices.
Lab data is a single test run in a controlled environment, like the score PageSpeed Insights or Lighthouse gives you. It is great for diagnosis. Field data is how your actual visitors experience the site, collected from real Chrome users over time (the Chrome UX Report). Google ranks on field data, not lab scores. A perfect lab score with poor field data still fails users, which is why we optimise toward the real-world numbers.
Aim for the "good" Core Web Vitals thresholds on real mobile devices: largest content in under 2.5 seconds, interactions responding in under 200 milliseconds, and almost no layout shifting. A common practical target is a fully usable page in around 2 to 3 seconds on a typical mobile connection. Faster is better, but reaching the "good" band is the goal that actually moves the needle for users and SEO.
A caching plugin helps, but it is one tool, not the whole job, and a badly configured one can break your layout or checkout. Caching does nothing for oversized images, render-blocking scripts, a heavy database or slow hosting. Real optimization measures the specific bottlenecks on your site and fixes each one, then verifies the result. The plugin is a single step, not the strategy.
A lot. Hosting sets your Time to First Byte, the delay before the server even starts responding, and it caps how fast everything else can be. Cheap, oversold shared hosting is one of the most common hidden bottlenecks. We tune what we can on your server (PHP version, object caching) and, if the host itself is genuinely holding you back, we tell you honestly and recommend a better option rather than papering over it.
For most sites, yes, especially if you have visitors outside your host's region. A content delivery network stores copies of your images, CSS and JavaScript on servers around the world and serves them from the one closest to each visitor, cutting distance and load time. It also adds modern delivery like HTTP/3 and better compression. A CDN is not a fix for a slow server or heavy page on its own, but it is a strong layer on top of good optimization.
Yes, and they are one of the most common causes. Every plugin can add CSS, JavaScript and database queries to your pages, and many load their assets on every page even where they are not used. The problem is rarely the number of plugins and more about their quality and how they load. Part of optimization is auditing which plugins actually earn their weight and removing or replacing the ones that do not.
Ongoing speed work is included in our maintenance plans, which run from $59/mo with no contracts. A one-off optimization for a single site is quoted after a free audit, because the price depends on what is actually slowing the site down. Simple fixes start from $99; a heavier optimization on a large or ecommerce site costs more. The audit tells us, and you, exactly what is needed before you commit to anything.
A focused one-off optimization typically takes a few days from audit to retest, depending on the site's size and how many issues it has. Some wins (caching, image compression, script cleanup) land immediately; others (database work, hosting changes, template fixes) take longer to do safely. We always back up first and test before and after, so speed is never gained at the cost of breaking something.
Yes, and stores need it most because a slow checkout costs sales directly. WooCommerce is heavier than a standard site: it cannot fully cache cart and checkout pages, it runs more database queries, and it often carries payment and shipping scripts. We optimize what can be safely cached, tune the database and server, and test the full checkout flow after every change so speed work never breaks a purchase.
No, and be cautious of anyone who does. PageSpeed Insights is a diagnostic lab tool; a perfect score there does not mean a perfect site, and chasing 100 can even hurt real users. What matters is field data, how the page performs for actual visitors, measured by Core Web Vitals. We optimize to hit the "good" real-world thresholds, which is the target that affects your users and your SEO.
We optimize on your own hosting account. We do not resell hosting or lock you into ours. If your host is genuinely the bottleneck we will tell you honestly and recommend a better option, but the account and control stay yours. Everything we change is backed up first, so the work is fully reversible.
Bhupesh Rathore is the founder of ThinkFlow Media and Linkflow.agency, with 8+ years in WordPress, SEO and website operations. He has built, scaled and maintained WordPress sites across business, ecommerce, SaaS and content niches, and speaks on SEO, most recently at the Chiang Mai SEO Conference 2025. He writes here to share practical, no-nonsense guidance on keeping WordPress sites secure, fast and profitable.